How Can We Help?
Pivot Table
Captisa Forms Pivot Grid allows you to create a pivot table for multi-dimensional data analysis. Using the Pivot Grid, large amounts of data can be summarized and represented in a cross-tabular format that can be sorted, grouped and filtered. You can customize the layout of the report based on their analysis requirements using simple drag-and-drop operations. The Pivot Grid also supports drill-down (to view the underlying data for calculated cells), exporting, and data visualization
Create Pivot Grid
1. Go to form explorer.
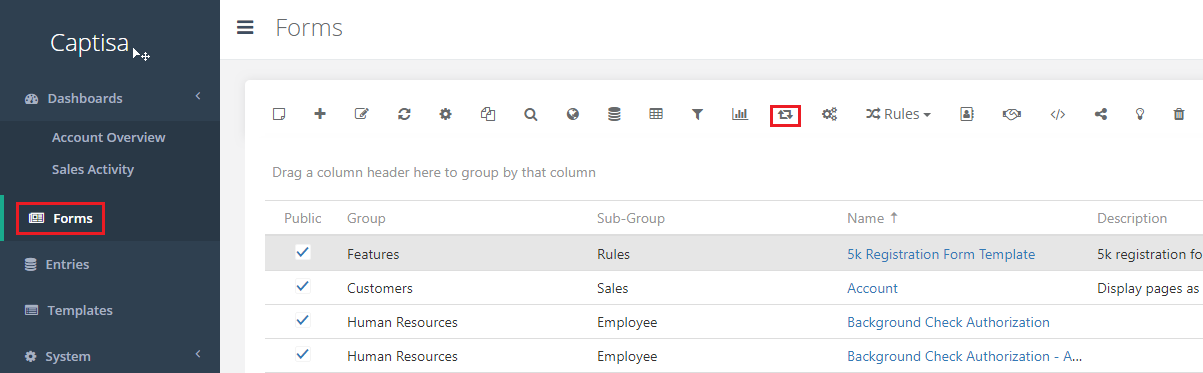
2. Select the form you want to create pivot grid, click on pivot grid button, and wait for the pivot grid form to load.
3. Define Pivot Grid
- 1Filter – Specify which filter definition must be used for the pivot grid.
- 2View – Specify which view definition must be used for drill-down grid.
- 3Field Panel – The field panel allows you to manage the displayed data. Drag and drop items from Fields to Rows, Columns, or Data panel.
- 4Chart Type – Select chart type so data can be displayed in a meaningful way. Captisa charts supports side-by-side bar, stacked bar, full stacked bar, line, spline, step line, area, spline area, pie, and doughnut.
- 5Pallette – Change the color palette for the chart by selecting a pre-defined palette.
- 6Legend Position – The Chart can include a legend – an explanatory component that helps you identify a series. Each series is represented by an item on a Legend. An item marker identifies the series color.
- 7Load – Load or refresh pivot grid.
- 8Drill Down to the Underlying Data – The Chart can include a legend – an explanatory component that helps you identify a series. Each series is represented by an item on a Legend. An item marker identifies the series color.

4. Click on Save button
Drill Down to the Underlying Data
A pivot grid cell value is a summary calculated against a data field for a subset of records. Click on cell to view underlying data in a grid view.
