How Can We Help?
Dashboards
Captisa Forms dashboard is an information management tool that visually tracks, analyzes and displays key performance indicators (KPI), metrics and key data points to monitor the health of a business, department or specific process. They are customizable to meet the specific needs of a department and company.
Create Dashboard
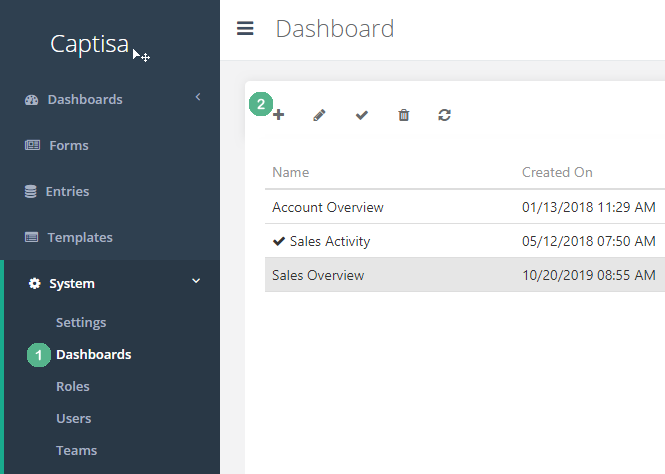
1. Go to Settings
- 1On navigation menu, click Dasboards
- 2Click Add button
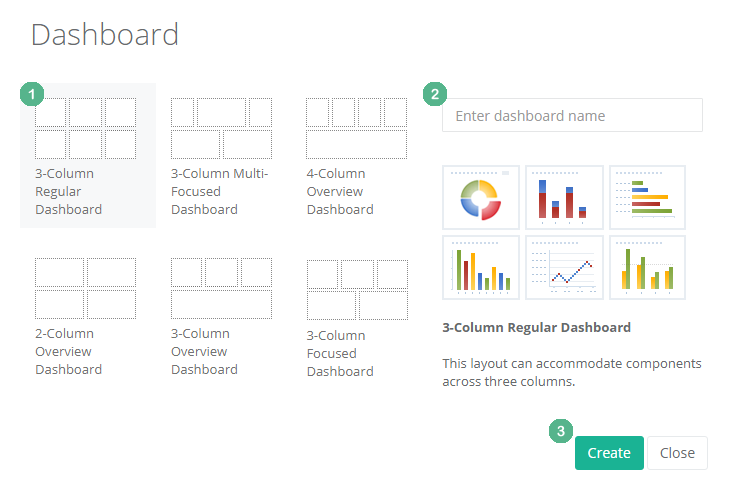
3. Dashboard Setup
- 1Select dashboard template
- 2Enter dashboard name
- 3Click on Create button
4. Select the new dashboard and then click on Edit button
Chart Widget
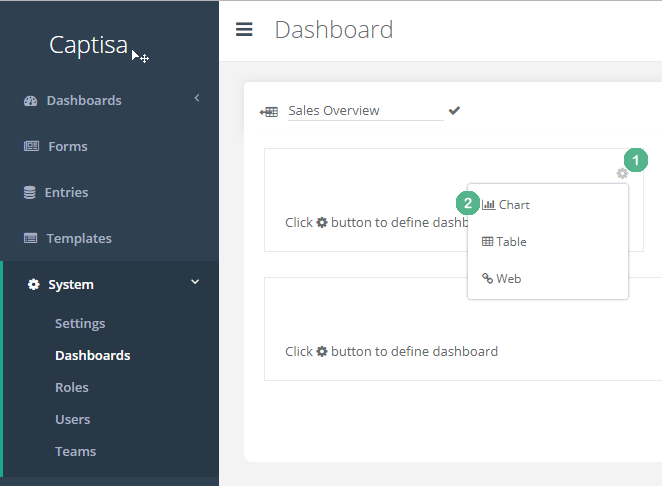
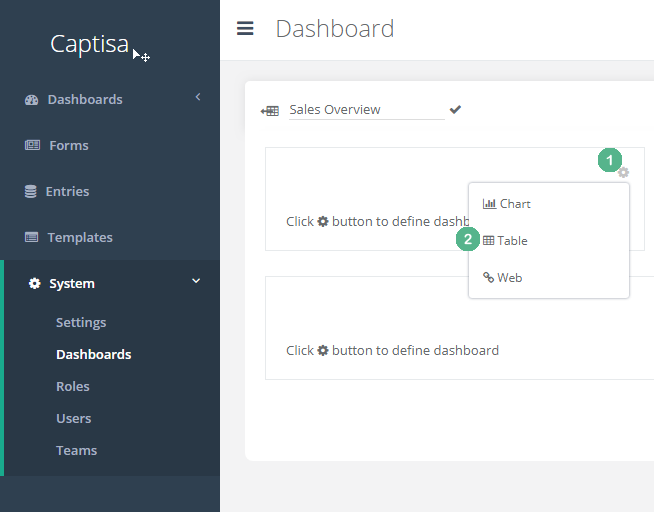
1. Add Chart Widget
- 1Select Cog button
- 2Select Chart
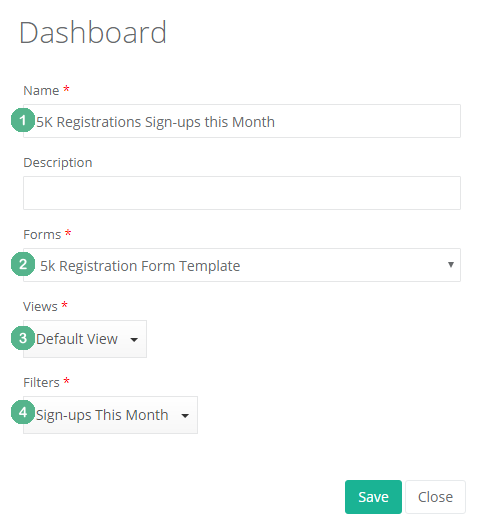
2. Chart Settings
- 1Enter chart name
- 2Select a form
- 3Select a chart
- 4Select filters. You can select 1 or more filters. This is useful when you want to switch between filters while viewing the chart.
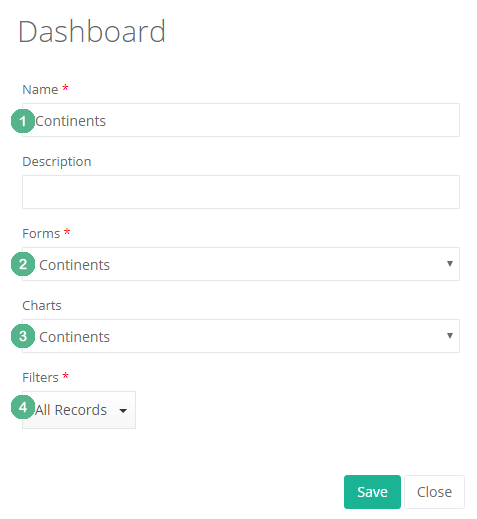
Table Widget
1. Add Table Widget
- 1Select Cog button
- 2Select Table
2. Table Settings
- 1Enter table name
- 2Select a form
- 3Select views. You can select 1 or more filters. This is useful when you want to switch between views while viewing the table.
- 4Select filters. You can select 1 or more filters. This is useful when you want to switch between filters while viewing the table.